Converts cluster results into a user provided annotation.
annotateGiotto(
  gobject,
  annotation_vector = NULL,
  cluster_column = NULL,
  name = "cell_types"
)
Arguments
| gobject | giotto object |
|---|---|
| annotation_vector | named annotation vector (names = cluster ids) |
| cluster_column | cluster column to convert to annotation names |
| name | new name for annotation column |
Value
giotto object
Details
You need to specifify which (cluster) column you want to annotate and you need to provide an annotation vector like this:
1. identify the cell type of each cluster
2. create a vector of these cell types, e.g. cell_types = c('T-cell', 'B-cell', 'Stromal')
3. provide original cluster names to previous vector, e.g. names(cell_types) = c(2, 1, 3)
Examples
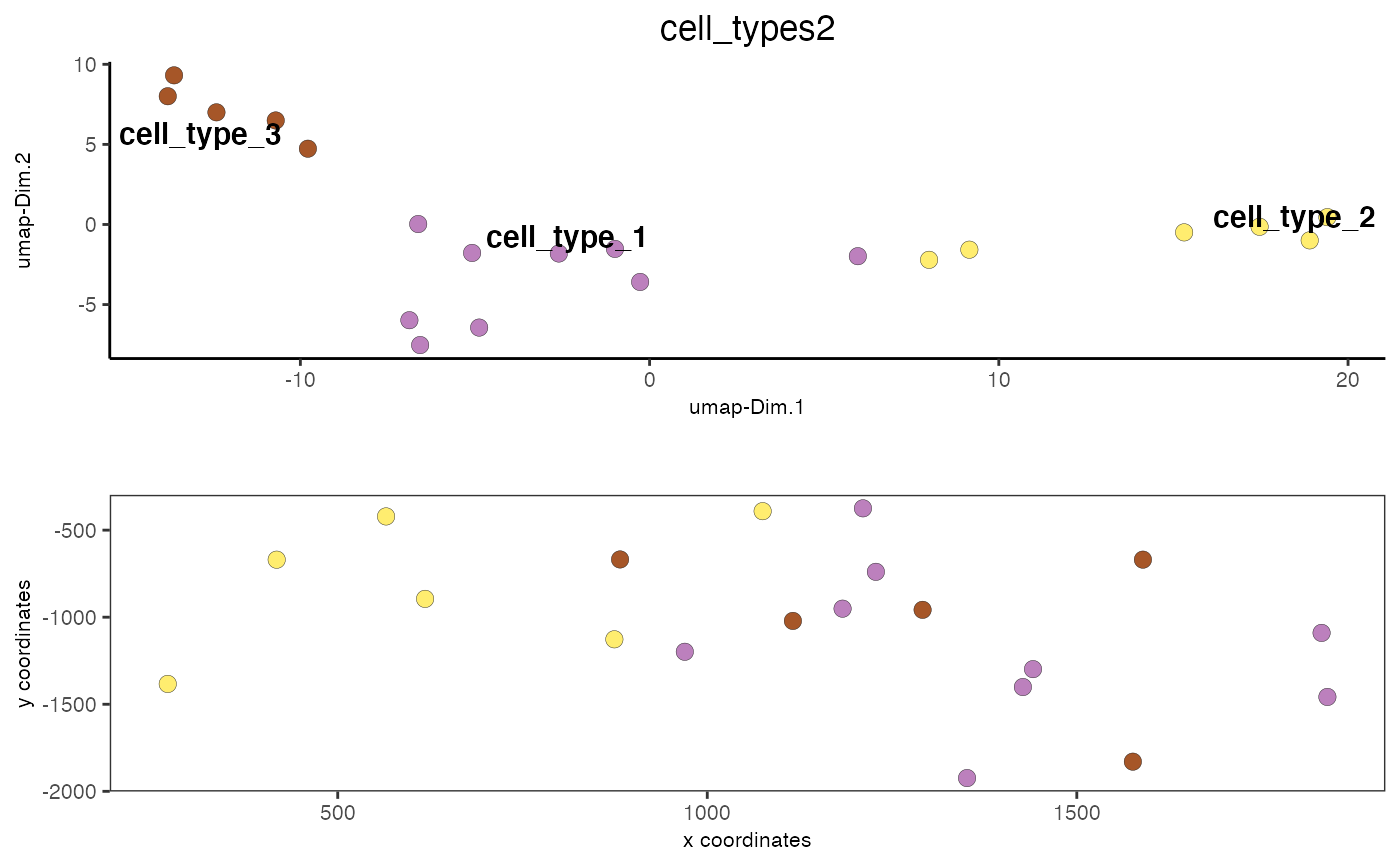
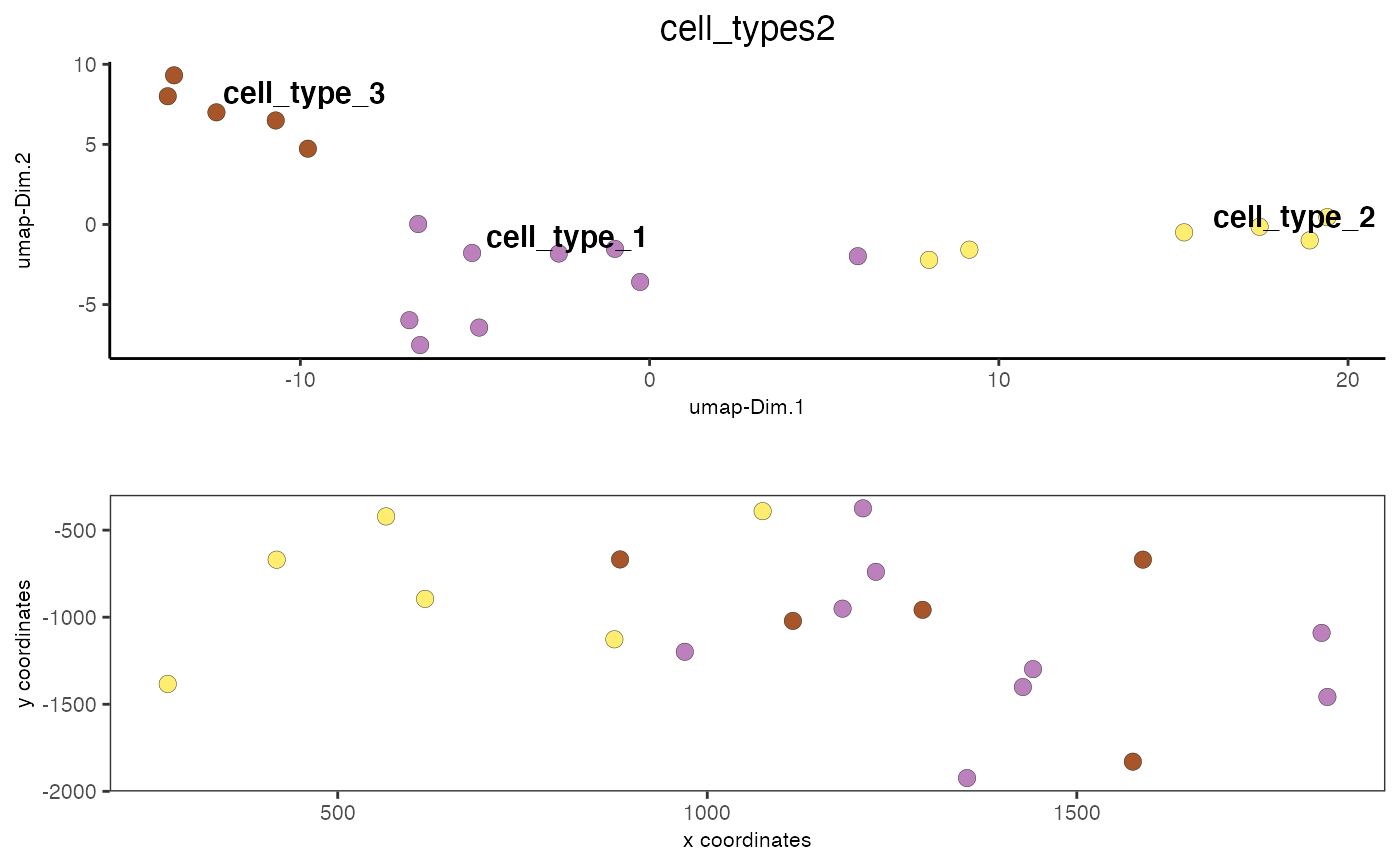
data(mini_giotto_single_cell) # show leiden clustering results cell_metadata = pDataDT(mini_giotto_single_cell) cell_metadata[['leiden_clus']]#> [1] 3 3 1 3 2 3 2 2 2 1 1 3 1 1 1 1 1 1 2 2# create vector with cell type names as names of the vector clusters_cell_types = c('cell_type_1', 'cell_type_2', 'cell_type_3') names(clusters_cell_types) = 1:3 # convert cluster results into annotations and add to cell metadata mini_giotto_single_cell = annotateGiotto(gobject = mini_giotto_single_cell, annotation_vector = clusters_cell_types, cluster_column = 'leiden_clus', name = 'cell_types2') # visualize annotation results spatDimPlot(gobject = mini_giotto_single_cell, cell_color = 'cell_types2', spat_point_size = 3, dim_point_size = 3)