compute highly variable genes
calculateHVG(
  gobject,
  expression_values = c("normalized", "scaled", "custom"),
  method = c("cov_groups", "cov_loess"),
  reverse_log_scale = FALSE,
  logbase = 2,
  expression_threshold = 0,
  nr_expression_groups = 20,
  zscore_threshold = 1.5,
  HVGname = "hvg",
  difference_in_cov = 0.1,
  show_plot = NA,
  return_plot = NA,
  save_plot = NA,
  save_param = list(),
  default_save_name = "HVGplot",
  return_gobject = TRUE
)
Arguments
| gobject | giotto object |
|---|---|
| expression_values | expression values to use |
| method | method to calculate highly variable genes |
| reverse_log_scale | reverse log-scale of expression values (default = FALSE) |
| logbase | if reverse_log_scale is TRUE, which log base was used? |
| expression_threshold | expression threshold to consider a gene detected |
| nr_expression_groups | number of expression groups for cov_groups |
| zscore_threshold | zscore to select hvg for cov_groups |
| HVGname | name for highly variable genes in cell metadata |
| difference_in_cov | minimum difference in coefficient of variance required |
| show_plot | show plot |
| return_plot | return ggplot object |
| save_plot | directly save the plot [boolean] |
| save_param | list of saving parameters from |
| default_save_name | default save name for saving, don't change, change save_name in save_param |
| return_gobject | boolean: return giotto object (default = TRUE) |
Value
giotto object highly variable genes appended to gene metadata (fDataDT)
Details
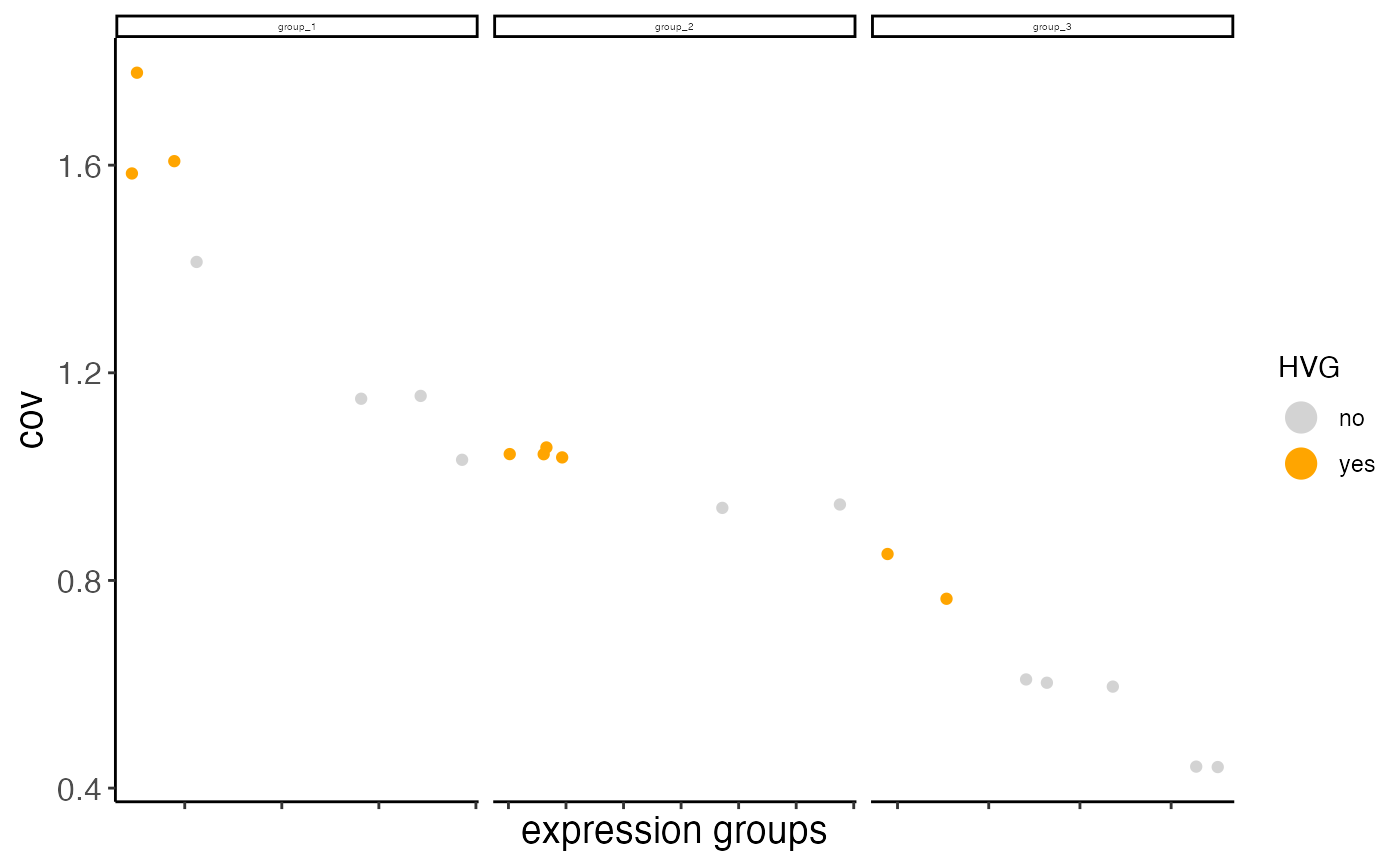
Currently we provide 2 ways to calculate highly variable genes:
1. high coeff of variance (COV) within groups:
First genes are binned (nr_expression_groups) into average expression groups and
the COV for each gene is converted into a z-score within each bin. Genes with a z-score
higher than the threshold (zscore_threshold) are considered highly variable.
2. high COV based on loess regression prediction:
A predicted COV is calculated for each gene using loess regression (COV~log(mean expression))
Genes that show a higher than predicted COV (difference_in_cov) are considered highly variable.
Examples
data(mini_giotto_single_cell) # loads existing Giotto object # update a giotto object mini_giotto_single_cell <- calculateHVG(gobject = mini_giotto_single_cell, zscore_threshold = 0.1, nr_expression_groups = 3)#> return_plot = TRUE and return_gobject = TRUE #> #> plot will not be returned to object, but can still be saved with save_plot = TRUE or manually #> #> hvg has already been used, will be overwritten# return a data.table with the high variable genes annotated hvg_dt <- calculateHVG(gobject = mini_giotto_single_cell, zscore_threshold = 0.1, nr_expression_groups = 3, return_plot = FALSE, return_gobject = FALSE)# return the ggplot object hvg_plot <- calculateHVG(gobject = mini_giotto_single_cell, zscore_threshold = 0.1, nr_expression_groups = 3, return_plot = TRUE, return_gobject = FALSE)