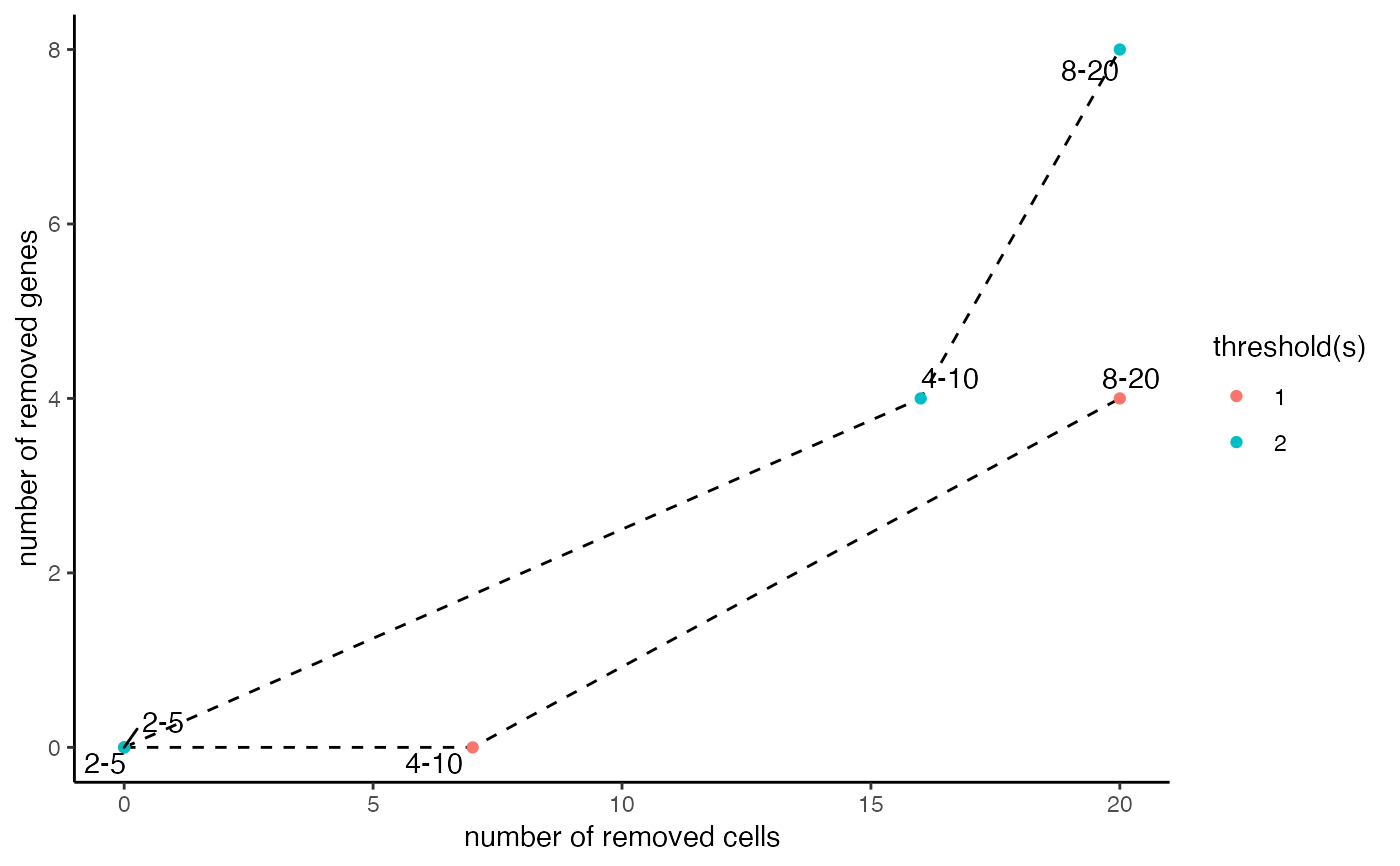
Shows how many genes and cells are lost with combinations of thresholds.
filterCombinations(
  gobject,
  expression_values = c("raw", "normalized", "scaled", "custom"),
  expression_thresholds = c(1, 2),
  gene_det_in_min_cells = c(5, 50),
  min_det_genes_per_cell = c(200, 400),
  scale_x_axis = "identity",
  x_axis_offset = 0,
  scale_y_axis = "identity",
  y_axis_offset = 0,
  show_plot = TRUE,
  return_plot = FALSE,
  save_plot = NA,
  save_param = list(),
  default_save_name = "filterCombinations"
)
Arguments
| gobject | giotto object |
|---|---|
| expression_values | expression values to use |
| expression_thresholds | all thresholds to consider a gene expressed |
| gene_det_in_min_cells | minimum number of cells that should express a gene to consider that gene further |
| min_det_genes_per_cell | minimum number of expressed genes per cell to consider that cell further |
| scale_x_axis | ggplot transformation for x-axis (e.g. log2) |
| x_axis_offset | x-axis offset to be used together with the scaling transformation |
| scale_y_axis | ggplot transformation for y-axis (e.g. log2) |
| y_axis_offset | y-axis offset to be used together with the scaling transformation |
| show_plot | show plot |
| return_plot | return only ggplot object |
| save_plot | directly save the plot [boolean] |
| save_param | list of saving parameters from |
| default_save_name | default save name for saving, don't change, change save_name in save_param |
Value
list of data.table and ggplot object
Details
Creates a scatterplot that visualizes the number of genes and cells that are lost with a specific combination of a gene and cell threshold given an arbitrary cutoff to call a gene expressed. This function can be used to make an informed decision at the filtering step with filterGiotto.
Examples
data(mini_giotto_single_cell) # assess the effect of multiple filter criteria filterCombinations(mini_giotto_single_cell, gene_det_in_min_cells = c(2, 4, 8), min_det_genes_per_cell = c(5, 10, 20))#>#> $results #> threshold gene_detected_in_min_cells min_detected_genes_per_cell combination #> 1: 1 2 5 2-5 #> 2: 1 4 10 4-10 #> 3: 1 8 20 8-20 #> 4: 2 2 5 2-5 #> 5: 2 4 10 4-10 #> 6: 2 8 20 8-20 #> removed_genes removed_cells #> 1: 0 0 #> 2: 0 7 #> 3: 4 20 #> 4: 0 0 #> 5: 4 16 #> 6: 8 20 #> #> $ggplot#>