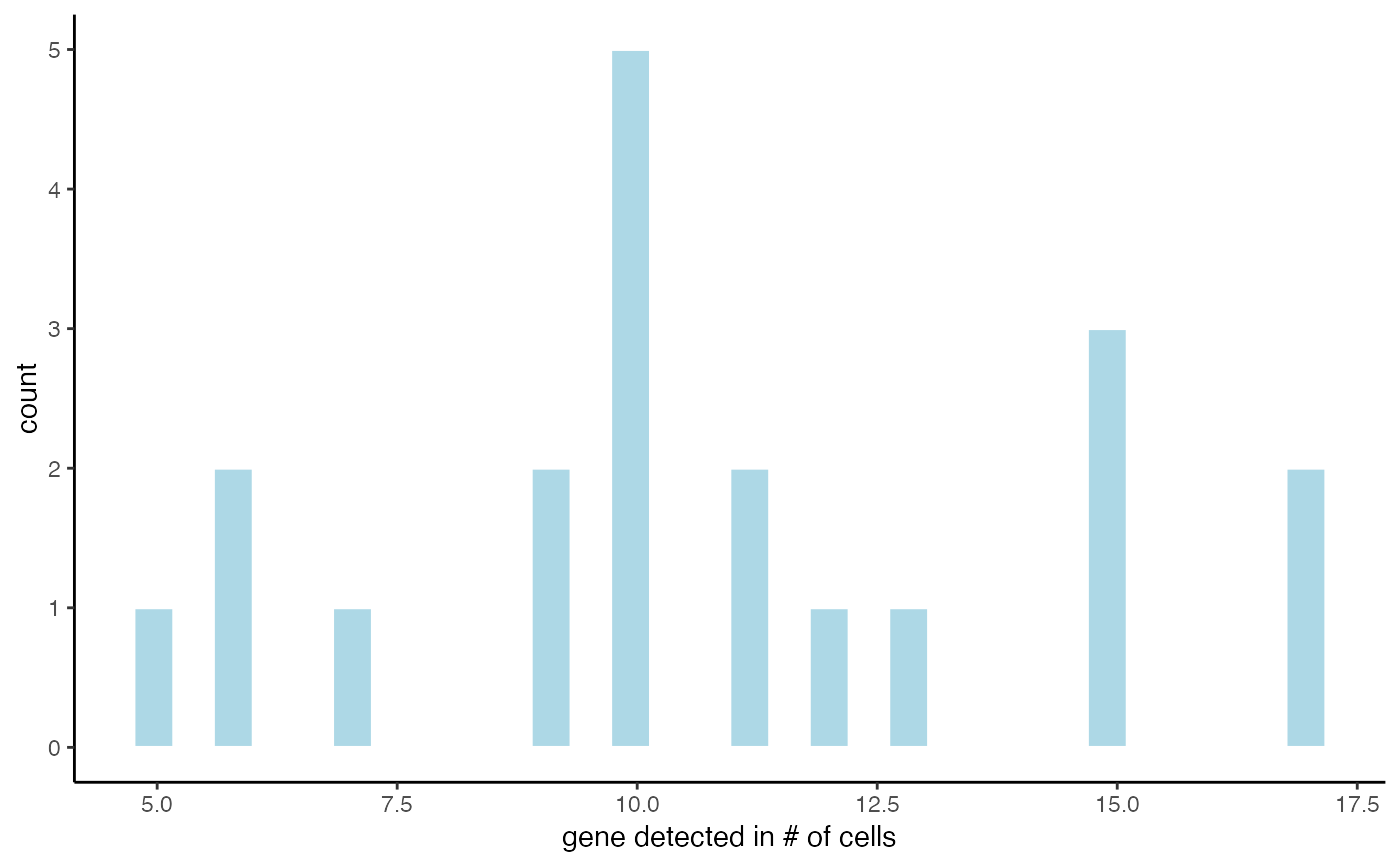
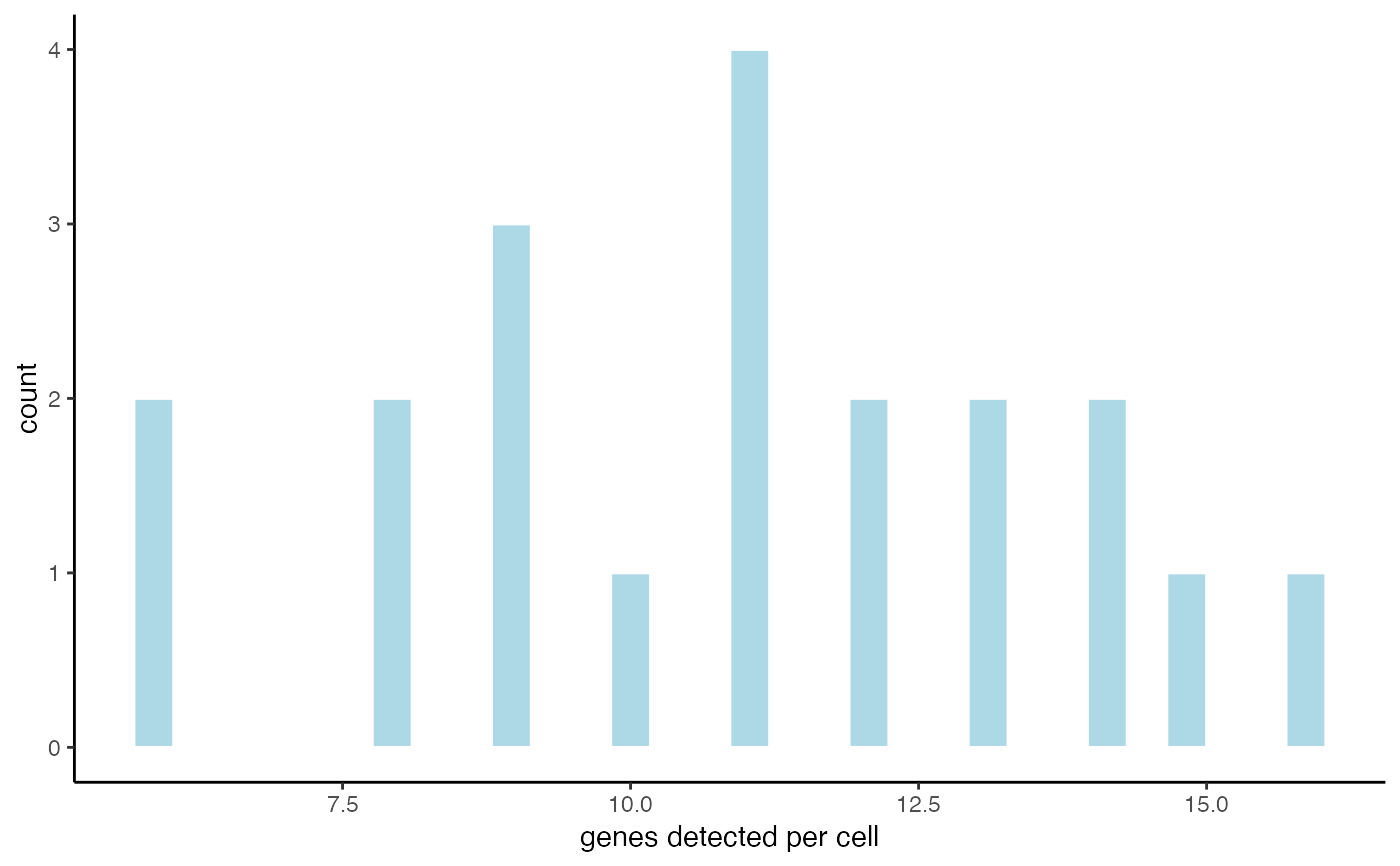
show gene or cell distribution after filtering on expression threshold
filterDistributions(
  gobject,
  expression_values = c("raw", "normalized", "scaled", "custom"),
  expression_threshold = 1,
  detection = c("genes", "cells"),
  plot_type = c("histogram", "violin"),
  nr_bins = 30,
  fill_color = "lightblue",
  scale_axis = "identity",
  axis_offset = 0,
  show_plot = NA,
  return_plot = NA,
  save_plot = NA,
  save_param = list(),
  default_save_name = "filterDistributions"
)
Arguments
| gobject | giotto object |
|---|---|
| expression_values | expression values to use |
| expression_threshold | threshold to consider a gene expressed |
| detection | consider genes or cells |
| plot_type | type of plot |
| nr_bins | number of bins for histogram plot |
| fill_color | fill color for plots |
| scale_axis | ggplot transformation for axis (e.g. log2) |
| axis_offset | offset to be used together with the scaling transformation |
| show_plot | show plot |
| return_plot | return ggplot object |
| save_plot | directly save the plot [boolean] |
| save_param | list of saving parameters from |
| default_save_name | default save name for saving, don't change, change save_name in save_param |
Value
ggplot object
Examples
data(mini_giotto_single_cell) # distribution plot of genes filterDistributions(mini_giotto_single_cell, detection = 'genes')# distribution plot of cells filterDistributions(mini_giotto_single_cell, detection = 'cells')