identify significant prinicipal components (PCs)
jackstrawPlot(
  gobject,
  expression_values = c("normalized", "scaled", "custom"),
  reduction = c("cells", "genes"),
  genes_to_use = NULL,
  center = FALSE,
  scale_unit = FALSE,
  ncp = 20,
  ylim = c(0, 1),
  iter = 10,
  threshold = 0.01,
  verbose = TRUE,
  show_plot = NA,
  return_plot = NA,
  save_plot = NA,
  save_param = list(),
  default_save_name = "jackstrawPlot"
)
Arguments
| gobject | giotto object |
|---|---|
| expression_values | expression values to use |
| reduction | cells or genes |
| genes_to_use | subset of genes to use for PCA |
| center | center data before PCA |
| scale_unit | scale features before PCA |
| ncp | number of principal components to calculate |
| ylim | y-axis limits on jackstraw plot |
| iter | number of interations for jackstraw |
| threshold | p-value threshold to call a PC significant |
| verbose | show progress of jackstraw method |
| show_plot | show plot |
| return_plot | return ggplot object |
| save_plot | directly save the plot [boolean] |
| save_param | list of saving parameters from all_plots_save_function() |
| default_save_name | default save name for saving, don't change, change save_name in save_param |
Value
ggplot object for jackstraw method
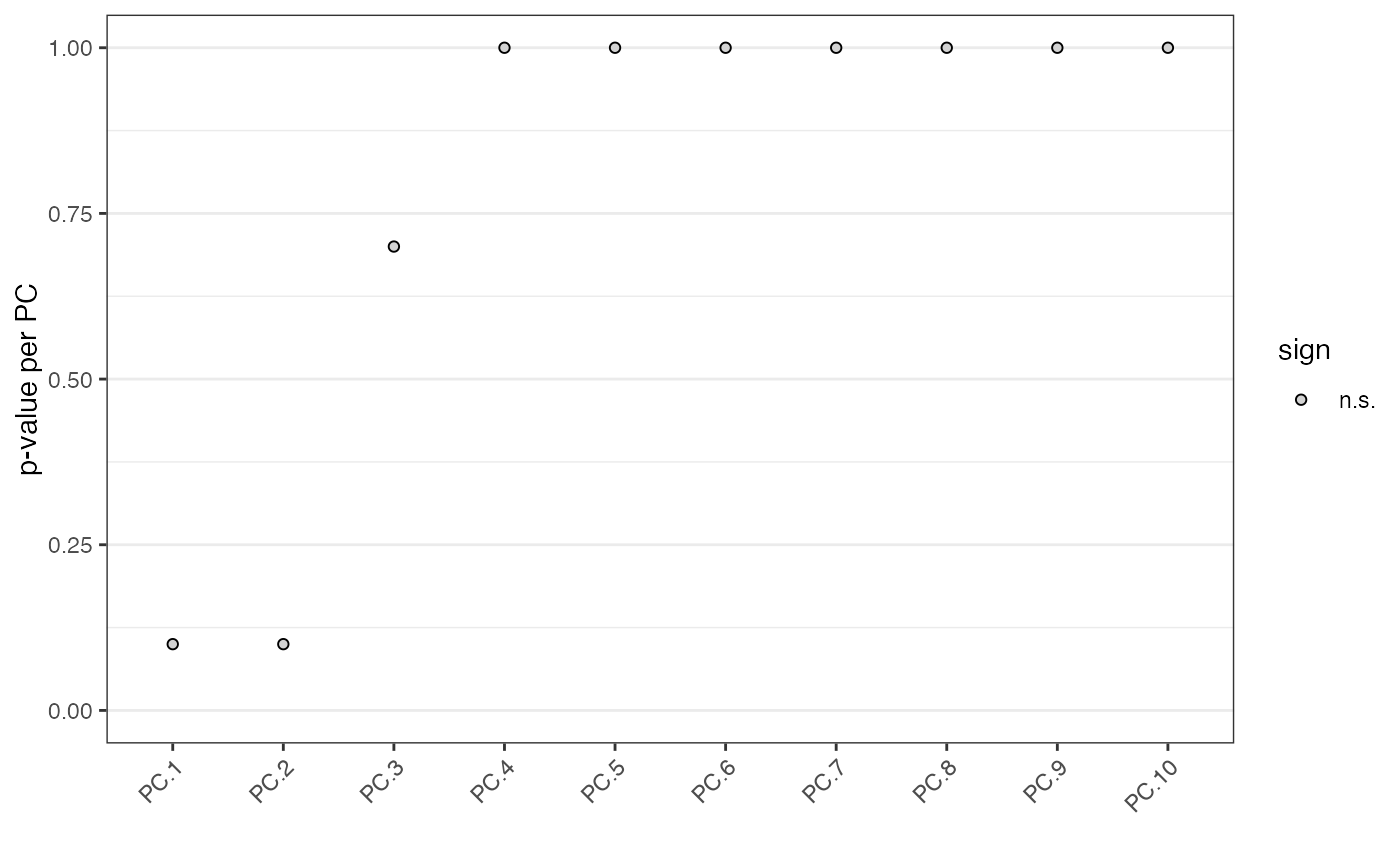
Details
The Jackstraw method uses the permutationPA function. By
systematically permuting genes it identifies robust, and thus significant, PCs.
Examples
# \donttest{ data(mini_giotto_single_cell) # jackstraw package is required to run jackstrawPlot(mini_giotto_single_cell, ncp = 10)#> #> #>#>#> 1 2 3 4 5 6 7 8 9 10 number of estimated significant components: 0# }