identify significant prinicipal components (PCs) using an screeplot (a.k.a. elbowplot)
screePlot(
  gobject,
  name = "pca",
  expression_values = c("normalized", "scaled", "custom"),
  reduction = c("cells", "genes"),
  method = c("irlba", "factominer"),
  rev = FALSE,
  genes_to_use = NULL,
  center = F,
  scale_unit = F,
  ncp = 100,
  ylim = c(0, 20),
  verbose = T,
  show_plot = NA,
  return_plot = NA,
  save_plot = NA,
  save_param = list(),
  default_save_name = "screePlot",
  ...
)
Arguments
| gobject | giotto object |
|---|---|
| name | name of PCA object if available |
| expression_values | expression values to use |
| reduction | cells or genes |
| method | which implementation to use |
| rev | do a reverse PCA |
| genes_to_use | subset of genes to use for PCA |
| center | center data before PCA |
| scale_unit | scale features before PCA |
| ncp | number of principal components to calculate |
| ylim | y-axis limits on scree plot |
| verbose | verobsity |
| show_plot | show plot |
| return_plot | return ggplot object |
| save_plot | directly save the plot [boolean] |
| save_param | list of saving parameters from all_plots_save_function() |
| default_save_name | default save name for saving, don't change, change save_name in save_param |
| ... | additional arguments to pca function, see |
Value
ggplot object for scree method
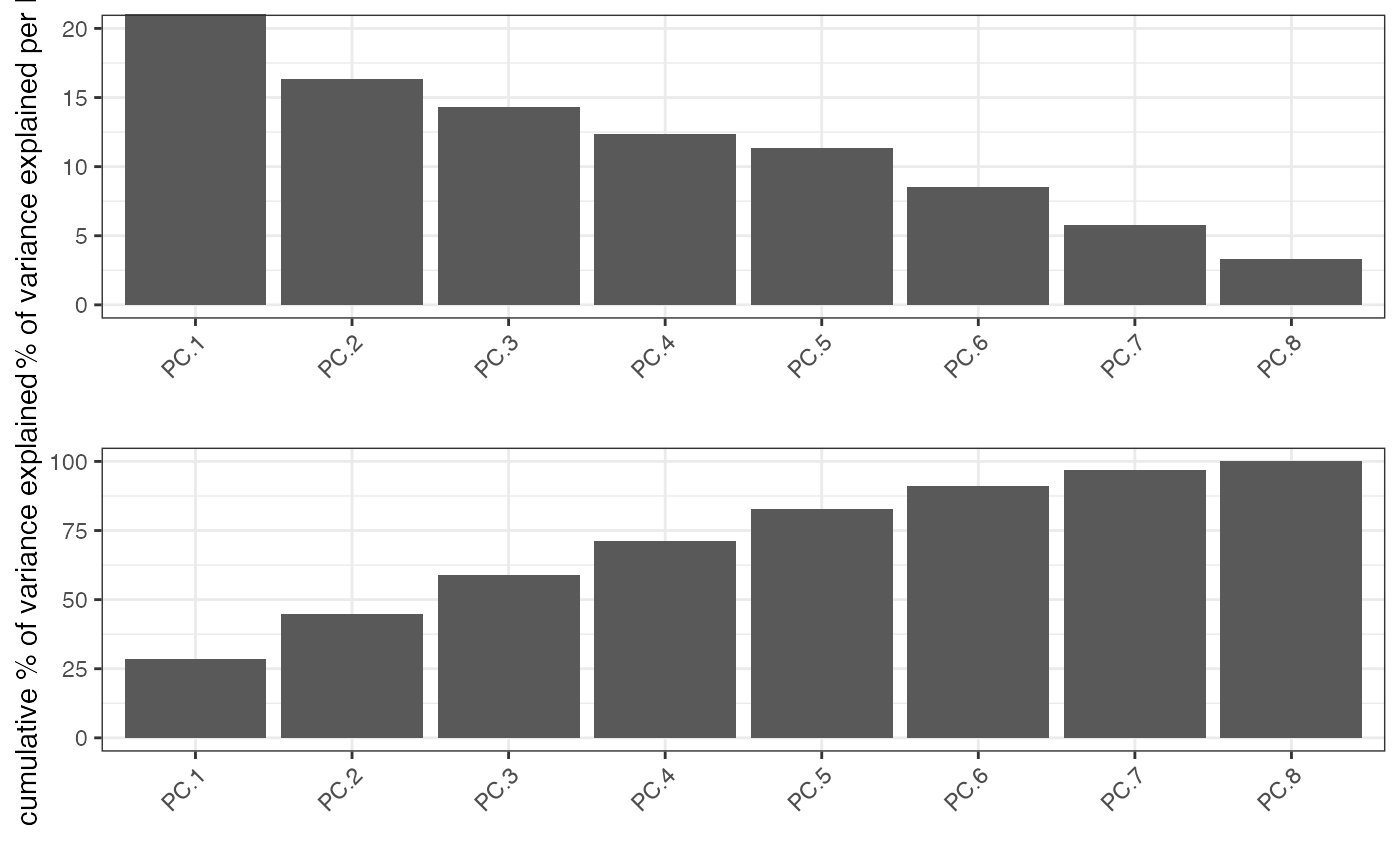
Details
Screeplot works by plotting the explained variance of each
individual PC in a barplot allowing you to identify which PC provides a significant
contribution (a.k.a 'elbow method').
Screeplot will use an available pca object, based on the parameter 'name', or it will
create it if it's not available (see runPCA)
Examples
#> PCA with name: pca already exists and will be used for the screeplot