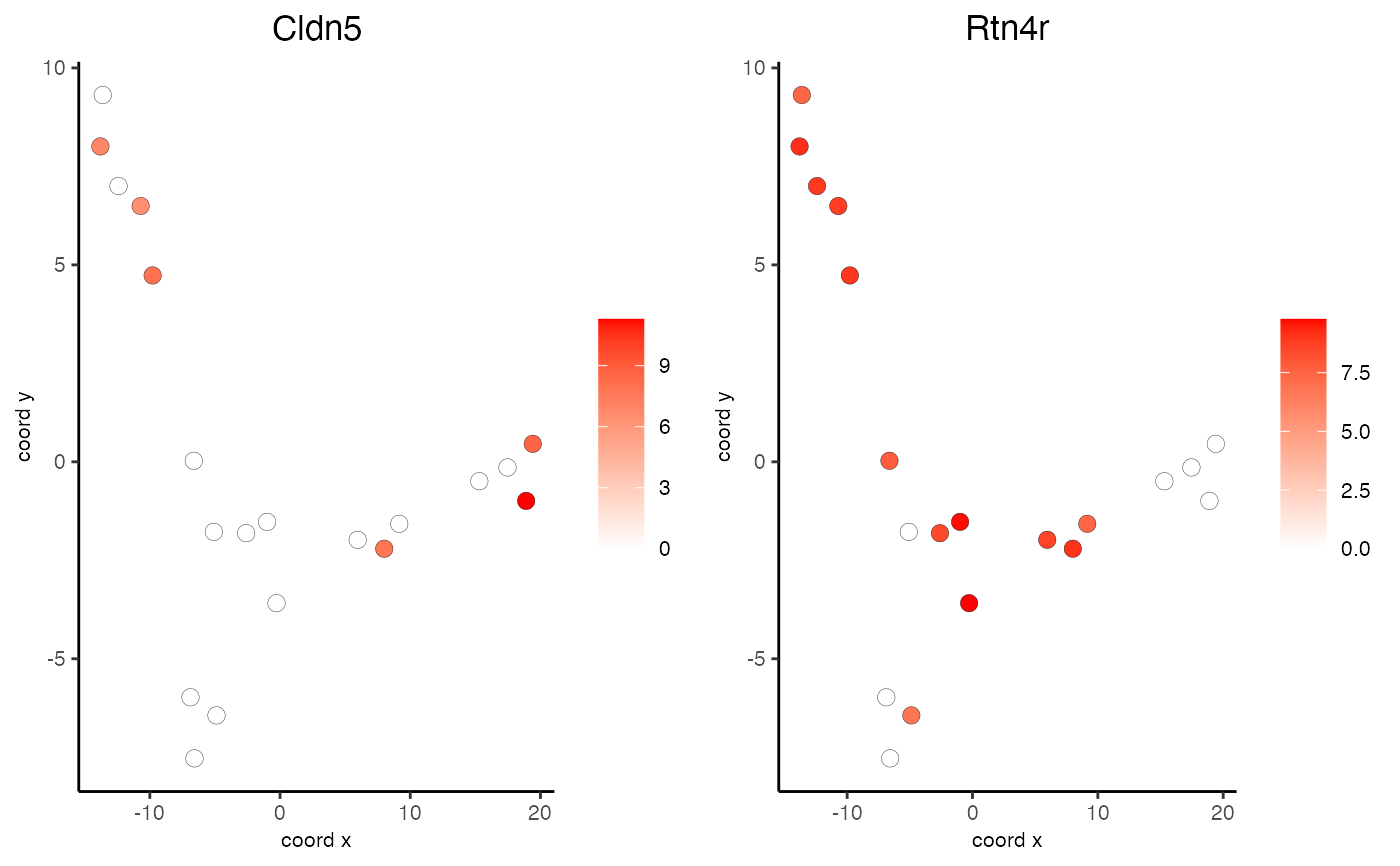
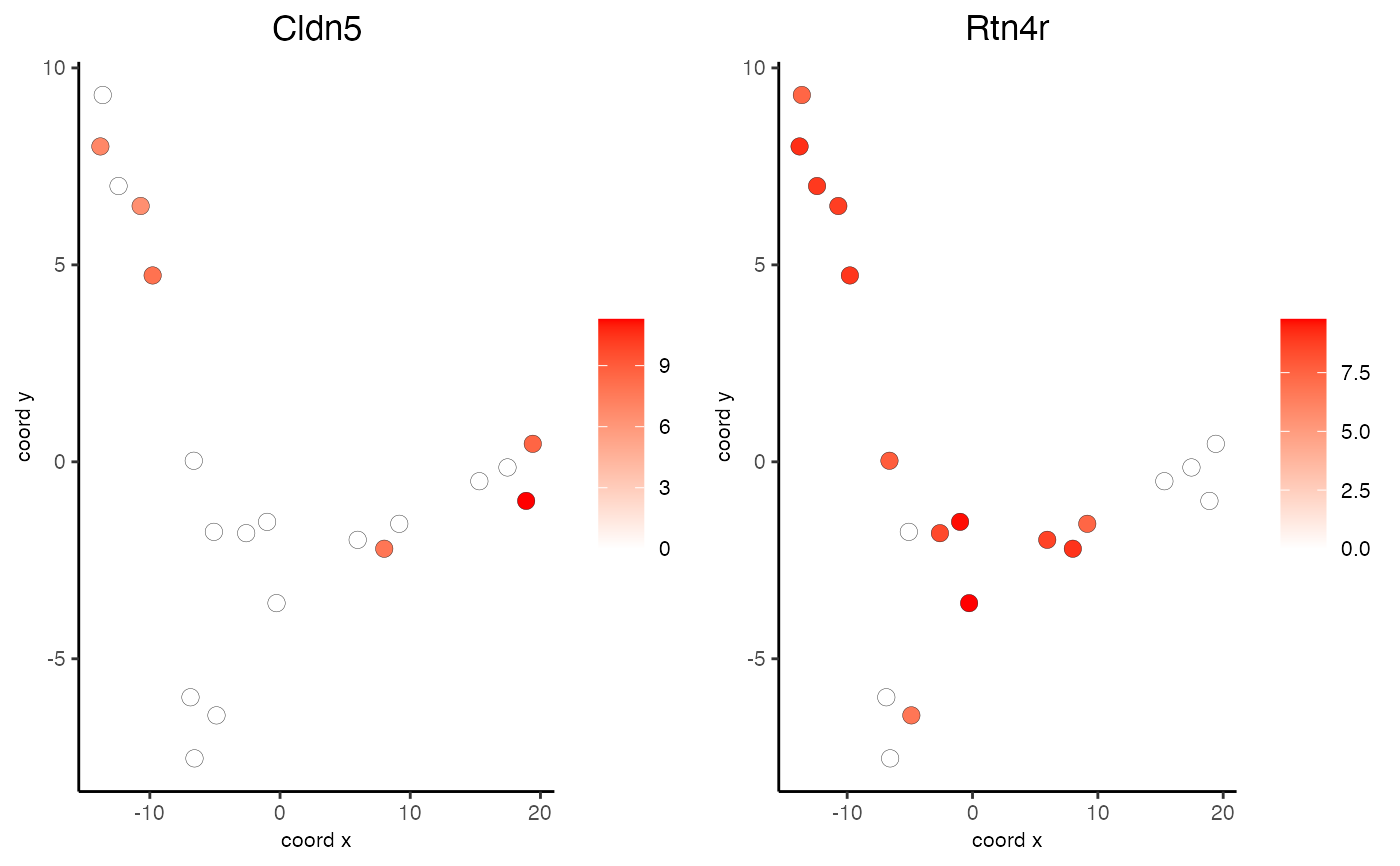
Visualize gene expression according to dimension reduction coordinates
dimGenePlot(...)
Arguments
| ... |
Arguments passed on to dimGenePlot2D
gobjectgiotto object expression_valuesgene expression values to use genesgenes to show dim_reduction_to_usedimension reduction to use dim_reduction_namedimension reduction name dim1_to_usedimension to use on x-axis dim2_to_usedimension to use on y-axis show_NN_networkshow underlying NN network nn_network_to_usetype of NN network to use (kNN vs sNN) network_namename of NN network to use, if show_NN_network = TRUE network_colorcolor of NN network edge_alphacolumn to use for alpha of the edges scale_alpha_with_expressionscale expression with ggplot alpha parameter point_shapepoint with border or not (border or no_border) point_sizesize of point (cell) point_alphatransparancy of points cell_color_gradientvector with 3 colors for numeric data gradient_midpointmidpoint for color gradient gradient_limitsvector with lower and upper limits point_border_colcolor of border around points point_border_strokestroke size of border around points show_legendshow legend legend_textsize of legend text background_colorcolor of plot background axis_textsize of axis text axis_titlesize of axis title cow_n_colcowplot param: how many columns cow_rel_hcowplot param: relative height cow_rel_wcowplot param: relative width cow_aligncowplot param: how to align show_plotshow plots return_plotreturn ggplot object save_plotdirectly save the plot [boolean] save_paramlist of saving parameters, see showSaveParameters default_save_namedefault save name for saving, don't change, change save_name in save_param |
Value
ggplot
Details
Description of parameters.
See also
Examples

