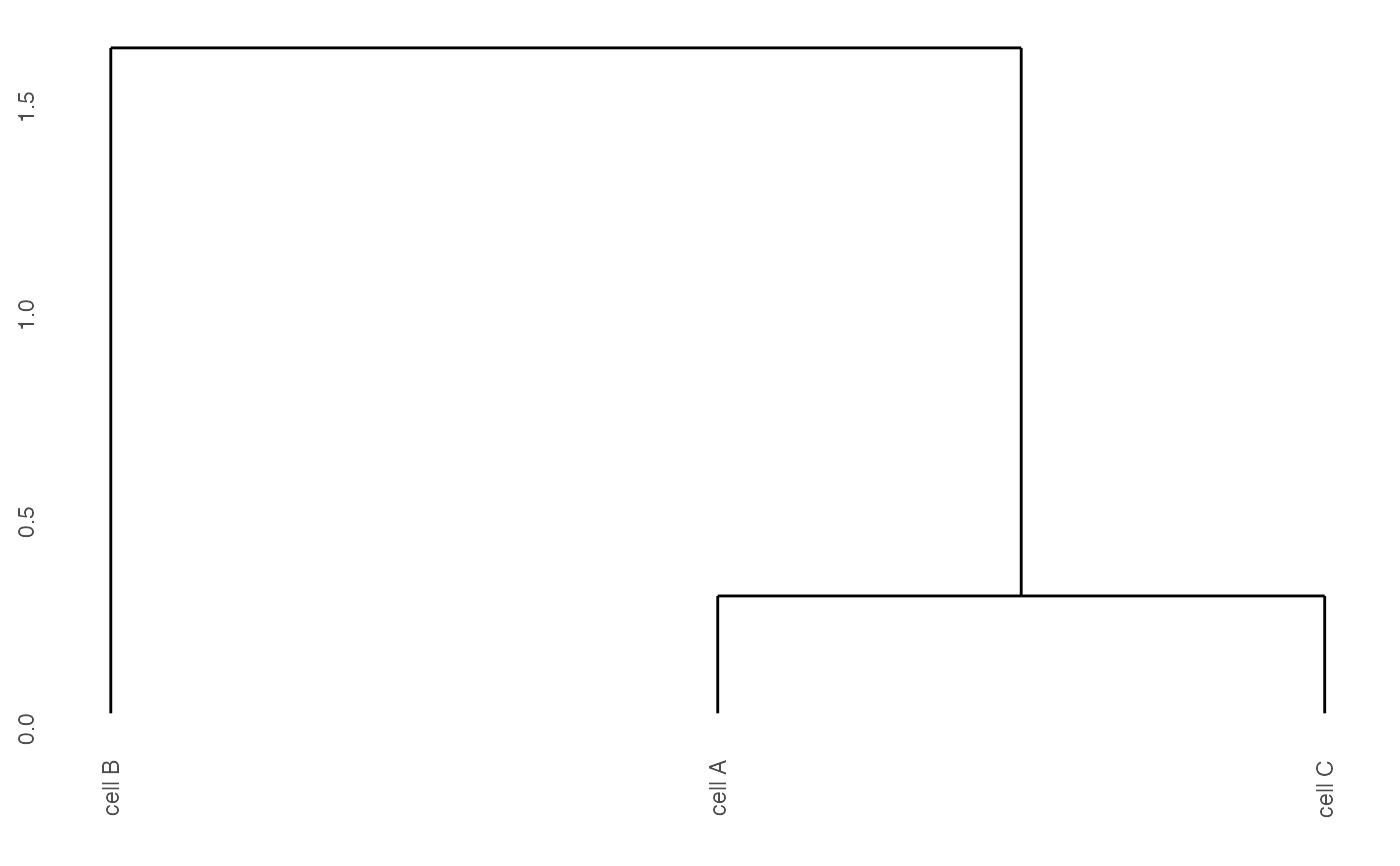
Creates dendrogram for selected clusters.
showClusterDendrogram(
  gobject,
  expression_values = c("normalized", "scaled", "custom"),
  cluster_column,
  cor = c("pearson", "spearman"),
  distance = "ward.D",
  h = NULL,
  h_color = "red",
  rotate = FALSE,
  show_plot = NA,
  return_plot = NA,
  save_plot = NA,
  save_param = list(),
  default_save_name = "showClusterDendrogram",
  ...
)
Arguments
| gobject | giotto object |
|---|---|
| expression_values | expression values to use |
| cluster_column | name of column to use for clusters |
| cor | correlation score to calculate distance |
| distance | distance method to use for hierarchical clustering |
| h | height of horizontal lines to plot |
| h_color | color of horizontal lines |
| rotate | rotate dendrogram 90 degrees |
| show_plot | show plot |
| return_plot | return ggplot object |
| save_plot | directly save the plot [boolean] |
| save_param | list of saving parameters, see |
| default_save_name | default save name for saving, don't change, change save_name in save_param |
| ... | additional parameters for ggdendrogram() |
Value
ggplot
Details
Expression correlation dendrogram for selected clusters.
Examples
data(mini_giotto_single_cell)

# cell metadata
cell_metadata = pDataDT(mini_giotto_single_cell)

# create heatmap
showClusterDendrogram(mini_giotto_single_cell,
                      cluster_column = 'cell_types')