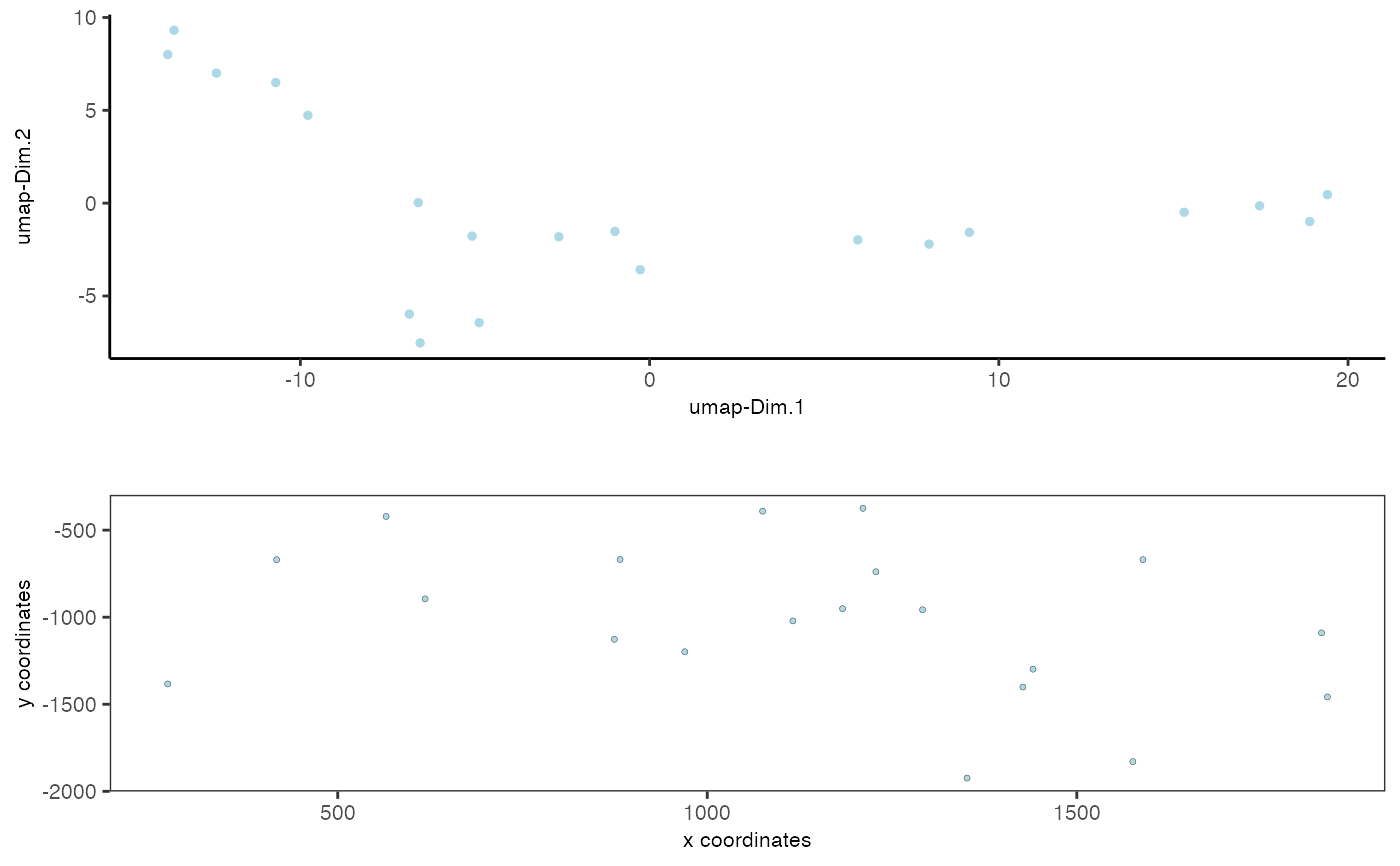
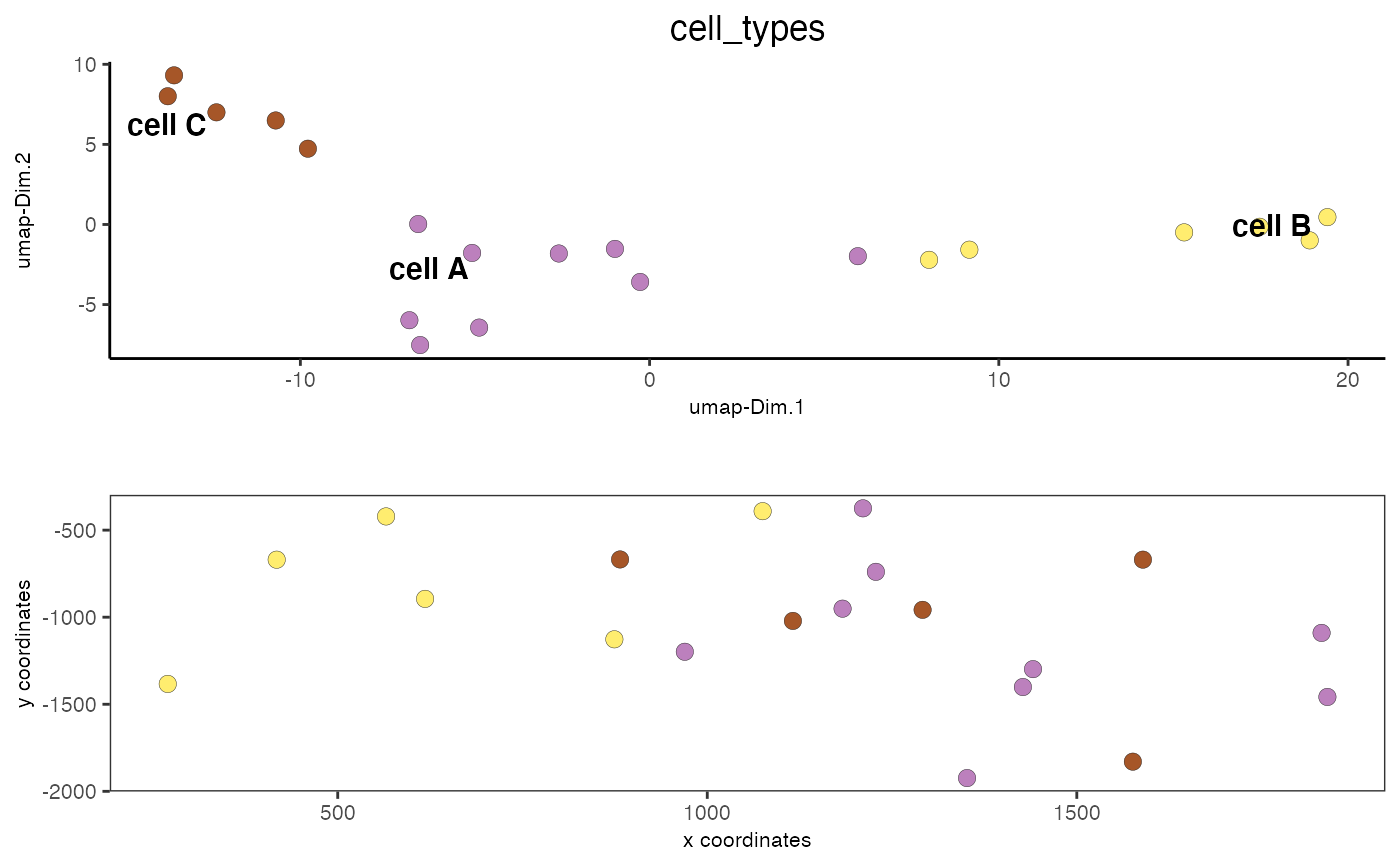
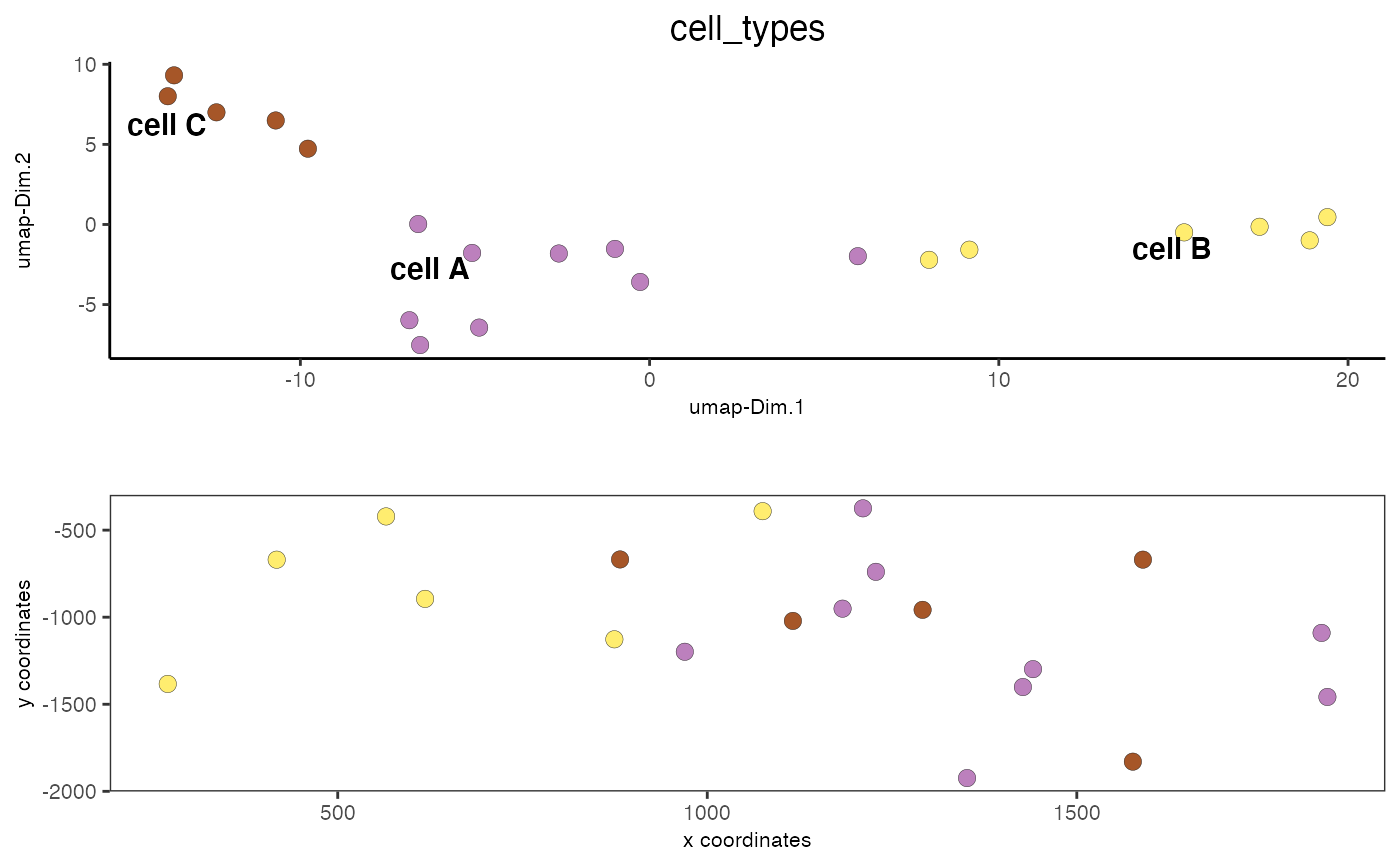
Visualize cells according to spatial AND dimension reduction coordinates 2D
spatDimPlot2D(
  gobject,
  show_image = F,
  gimage = NULL,
  image_name = "image",
  plot_alignment = c("vertical", "horizontal"),
  dim_reduction_to_use = "umap",
  dim_reduction_name = "umap",
  dim1_to_use = 1,
  dim2_to_use = 2,
  sdimx = "sdimx",
  sdimy = "sdimy",
  spat_enr_names = NULL,
  cell_color = NULL,
  color_as_factor = T,
  cell_color_code = NULL,
  cell_color_gradient = c("blue", "white", "red"),
  gradient_midpoint = NULL,
  gradient_limits = NULL,
  select_cell_groups = NULL,
  select_cells = NULL,
  dim_point_shape = c("border", "no_border"),
  dim_point_size = 1,
  dim_point_alpha = 1,
  dim_point_border_col = "black",
  dim_point_border_stroke = 0.1,
  spat_point_shape = c("border", "no_border", "voronoi"),
  spat_point_size = 1,
  spat_point_alpha = 1,
  spat_point_border_col = "black",
  spat_point_border_stroke = 0.1,
  dim_show_cluster_center = F,
  dim_show_center_label = T,
  dim_center_point_size = 4,
  dim_center_point_border_col = "black",
  dim_center_point_border_stroke = 0.1,
  dim_label_size = 4,
  dim_label_fontface = "bold",
  spat_show_cluster_center = F,
  spat_show_center_label = F,
  spat_center_point_size = 4,
  spat_center_point_border_col = "blue",
  spat_center_point_border_stroke = 0.1,
  spat_label_size = 4,
  spat_label_fontface = "bold",
  show_NN_network = F,
  nn_network_to_use = "sNN",
  network_name = "sNN.pca",
  nn_network_alpha = 0.05,
  show_spatial_network = F,
  spat_network_name = "Delaunay_network",
  spat_network_color = "blue",
  spat_network_alpha = 0.5,
  show_spatial_grid = F,
  spat_grid_name = "spatial_grid",
  spat_grid_color = "blue",
  show_other_cells = T,
  other_cell_color = "lightgrey",
  dim_other_point_size = 1,
  spat_other_point_size = 1,
  spat_other_cells_alpha = 0.5,
  dim_show_legend = F,
  spat_show_legend = F,
  legend_text = 8,
  legend_symbol_size = 1,
  dim_background_color = "white",
  spat_background_color = "white",
  vor_border_color = "white",
  vor_max_radius = 200,
  vor_alpha = 1,
  axis_text = 8,
  axis_title = 8,
  show_plot = NA,
  return_plot = NA,
  save_plot = NA,
  save_param = list(),
  default_save_name = "spatDimPlot2D"
)
Arguments
| gobject | giotto object |
|---|---|
| show_image | show a tissue background image |
| gimage | a giotto image |
| image_name | name of a giotto image |
| plot_alignment | direction to align plot |
| dim_reduction_to_use | dimension reduction to use |
| dim_reduction_name | dimension reduction name |
| dim1_to_use | dimension to use on x-axis |
| dim2_to_use | dimension to use on y-axis |
| sdimx | = spatial dimension to use on x-axis |
| sdimy | = spatial dimension to use on y-axis |
| spat_enr_names | names of spatial enrichment results to include |
| cell_color | color for cells (see details) |
| color_as_factor | convert color column to factor |
| cell_color_code | named vector with colors |
| cell_color_gradient | vector with 3 colors for numeric data |
| gradient_midpoint | midpoint for color gradient |
| gradient_limits | vector with lower and upper limits |
| select_cell_groups | select subset of cells/clusters based on cell_color parameter |
| select_cells | select subset of cells based on cell IDs |
| dim_point_shape | point with border or not (border or no_border) |
| dim_point_size | size of points in dim. reduction space |
| dim_point_alpha | transparancy of point in dim. reduction space |
| dim_point_border_col | border color of points in dim. reduction space |
| dim_point_border_stroke | border stroke of points in dim. reduction space |
| spat_point_shape | shape of points (border, no_border or voronoi) |
| spat_point_size | size of spatial points |
| spat_point_alpha | transparancy of spatial points |
| spat_point_border_col | border color of spatial points |
| spat_point_border_stroke | border stroke of spatial points |
| dim_show_cluster_center | show the center of each cluster |
| dim_show_center_label | provide a label for each cluster |
| dim_center_point_size | size of the center point |
| dim_center_point_border_col | border color of center point |
| dim_center_point_border_stroke | stroke size of center point |
| dim_label_size | size of the center label |
| dim_label_fontface | font of the center label |
| spat_show_cluster_center | show the center of each cluster |
| spat_show_center_label | provide a label for each cluster |
| spat_center_point_size | size of the center point |
| spat_center_point_border_col | border color of spatial center points |
| spat_center_point_border_stroke | border strike size of spatial center points |
| spat_label_size | size of the center label |
| spat_label_fontface | font of the center label |
| show_NN_network | show underlying NN network |
| nn_network_to_use | type of NN network to use (kNN vs sNN) |
| network_name | name of NN network to use, if show_NN_network = TRUE |
| nn_network_alpha | column to use for alpha of the edges |
| show_spatial_network | show spatial network |
| spat_network_name | name of spatial network to use |
| spat_network_color | color of spatial network |
| spat_network_alpha | alpha of spatial network |
| show_spatial_grid | show spatial grid |
| spat_grid_name | name of spatial grid to use |
| spat_grid_color | color of spatial grid |
| show_other_cells | display not selected cells |
| other_cell_color | color of not selected cells |
| dim_other_point_size | size of not selected dim cells |
| spat_other_point_size | size of not selected spat cells |
| spat_other_cells_alpha | alpha of not selected spat cells |
| dim_show_legend | show legend of dimension reduction plot |
| spat_show_legend | show legend of spatial plot |
| legend_text | size of legend text |
| legend_symbol_size | size of legend symbols |
| dim_background_color | background color of points in dim. reduction space |
| spat_background_color | background color of spatial points |
| vor_border_color | border colorr for voronoi plot |
| vor_max_radius | maximum radius for voronoi 'cells' |
| vor_alpha | transparancy of voronoi 'cells' |
| axis_text | size of axis text |
| axis_title | size of axis title |
| show_plot | show plot |
| return_plot | return ggplot object |
| save_plot | directly save the plot [boolean] |
| save_param | list of saving parameters, see |
| default_save_name | default save name for saving, don't change, change save_name in save_param |
Value
ggplot
Details
Description of parameters.
See also
Other spatial and dimension reduction visualizations:
spatDimPlot3D(),
spatDimPlot()
Examples
spatDimPlot2D(mini_giotto_single_cell, cell_color = 'cell_types', spat_point_size = 3, dim_point_size = 3)